This report displays a summary of the review ratings cross-tabulated by the field you select in the "Show Status By" drop-down list. The results display a row for the selected demographic value (ex. Location, Job Code, Employment Type, etc.) and the total or percentage of performance reviews for each overall performance rating.
To run this report:
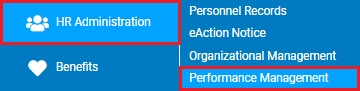
1. On the Menu, click HR Administration > Performance ManagementHR Administration > Performance Management.
The Performance Management DashboardPerformance Management Dashboard page displays.
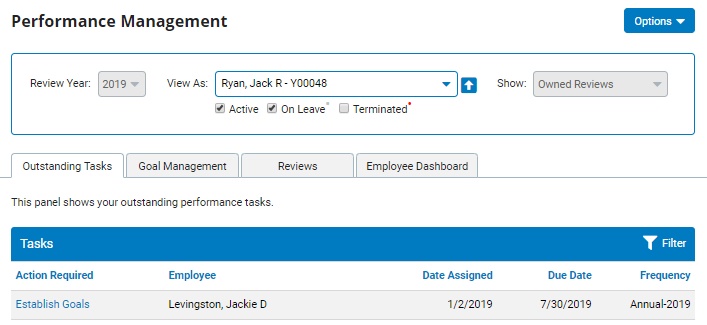
2. Click on the OptionsOptions button and select Reports from the drop-down list.

The Performance Management Reports page displays.
3. Click the Rating Distribution report from the displayed list of available reports.
The Review Rating DistributionReview Rating Distribution report template page displays.
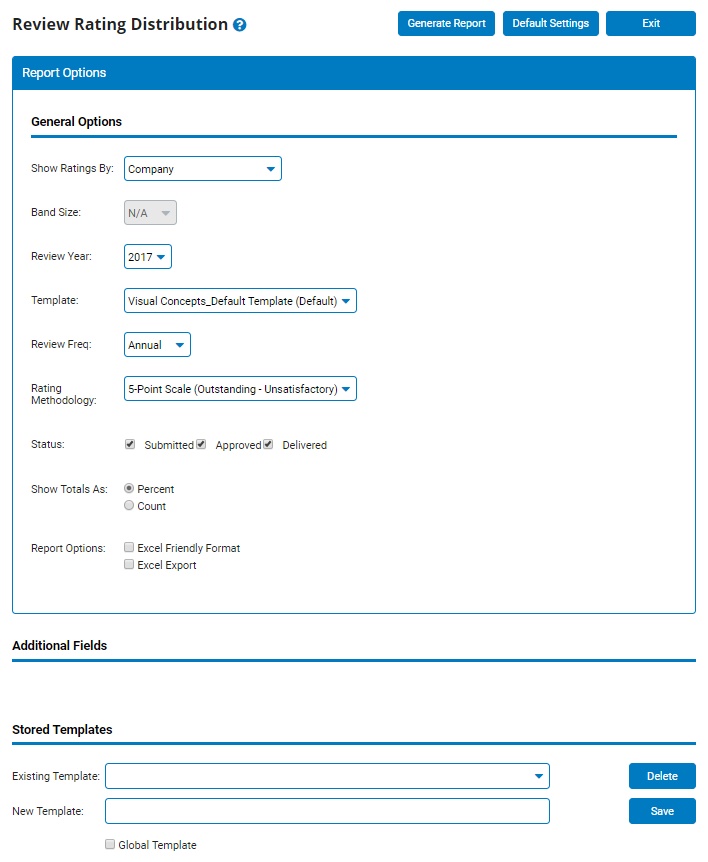
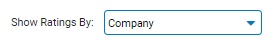
4. In the Show Ratings ByShow Ratings By drop-down list, choose which field the report results should be used to group (cross-tabulate).
5. When choosing to view the distribution of ratings by a demographic field that is based on years (ex. age, tenure, etc.), the Band SizeBand Size drop-down provides the ability to group employees together that fall within a set range of years.
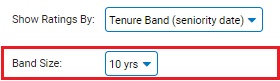
For example, choosing to use a tenure band size of 10 yrs, the results will show the rating distribution totals for all employees who have been employed for 0-10, 11-20, 21-30, etc. years.
6. Choose which year the results should be for in the Review YearReview Year field.
7. The TemplateTemplate field reflects all active templates for the selected review year.
8. The Review FrequencyReview Frequency drop-down list reflects all of the frequency of reviews that applicable for the selected review year.
9. If more than one overall rating methodology is used in the selected review year/template/frequency options, pick the applicable rating scale in the Rating MethodologyRating Methodology drop-down list that is to be included in the report results.
10. Check all the applicable review statuses in the StatusStatus section that are to be included in the report results.

11. Make the appropriate selection in the Show Total AsShow Total As section to govern how results are displayed.
Percent - If selected, the generated results display the percentage of reviews in each status for each row (ex. Location, Job Code, Employment Type, etc.).
Count - If selected, the generated results display the number of reviews in each status for each row (ex. Location, Job Code, Employment Type, etc.).
12. If necessary, select additional display options for the report from the Report Options checkboxes.
Notes:
Checking the Excel Friendly Format checkbox formats report results to allow for a "cut and paste" transfer to an Excel form. This option will suppress Groups and Subtotals unless the Show Totals Only checkbox is also selected.
Checking the Excel Export checkbox will export the report directly as an Excel file.
13. Click the Generate ReportGenerate Report button.

Result: The report you selected displays in a new window with the options you selected.
Notes:
You may print the report by clicking the PrintPrint button.

You may close the report by clicking the CloseClose button.

Related Help Topics:
Generating and Formatting a Report
Generating a Report Using a Template
Managing Performance Rating Scales